This post, part of an introductory series to Front End Optimisation practice, considers detailed analysis of clientside components. It is a relatively high level treatment. A list of sources for more detailed study will be provided in the final (summary) post.
Other titles in this blog series are:
-
- FEO – reports of its death have been much exaggerated – 22 February 2016 [also published in APM Digest]
- Introduction to FEO – Tooling Part 1 – 1 March 2016
- Introduction to FEO – Tooling Part 2 – 8 March 2016
- Introduction to FEO – Operations – Process – 15 March 2016
- Introduction to FEO – Granular Analysis Part 1 – 22 March 2016
- Introduction to FEO – Granular analysis Part 2 -29 March 2016
- Introduction to FEO – Granular analysis Part 3 – 5 April 2016
- Introduction to FEO – Edge Case management – 12 April 2016
- Introduction to FEO – Summary, bibliography for further study – 12 April 2016
Granular analysis Part 2 – Component-level characteristics
In the post on 22 March, we looked at the use of detailed, external-monitoring based scrutiny of site performance. Careful consideration of this data (for example, the effect of third party components on browser fill times between ISPs or at different connection speeds), should deliver value in two areas: i) the performance characteristics of the site, for example latency to international markets, or excessive variation during periods of high demand, and ii) some understanding of the root cause of the issues – client side/ server side, DNS lookup, image content delivery, or whatever.
Armed with this knowledge, we can now focus our optimisation efforts on causation in specific areas, using appropriate ‘deep dive’ tooling. This approach will be both more time and cost effective than seeking to apply ‘broad brush’ solutions such as increasing infrastructure capacity.
Detailed interventions will obviously depend upon the nature of the issue(s) encountered, but a number of sources exist which consider specifics in more detail than is possible here (see bibliography in summary post).
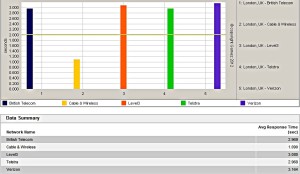
ISP Peerage chart (dynaTrace synthetic)
- Component level analysis
Following investigation of response anomalies, it is useful to undertake some detailed analysis of the client-side components of the target page(s) – for example each individual page in a key revenue-bearing transaction – what is sometimes termed ‘static’ (as opposed to ‘dynamic’) analysis.
Raw data from representative individual tests (in controlled conditions) should be downloaded and examined. It can be particularly useful to compare with a similar high-performance reference site (possibly a competitor). Such analysis should include consideration of both individual components and network packet capture [PCAP] traces.
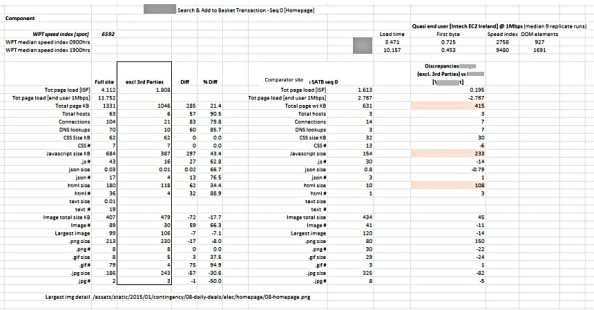
‘Static analysis’ Individual component/competitor comparison
Notes regarding investigation of individual components:
- Client-side logic (JavaScript). Consider:
- The absolute number of scripts and their blocking behaviour (if any)
- Download source, number of domains
- Code size – compression, minification.
- Code coverage.
- .js total duration vs execution time. Long duration scripts should be examined to understand which elements consume the most time overall
- CPU overhead – particularly important if delivered to limited capacity mobile devices
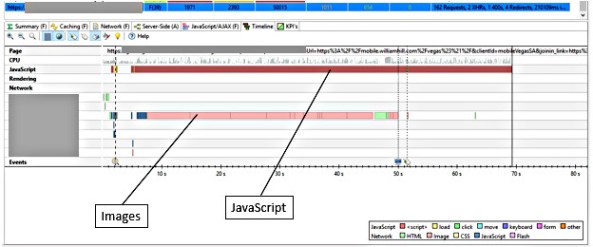
Example – Intensive JavaScript processing (Chrome developer tools timeline)
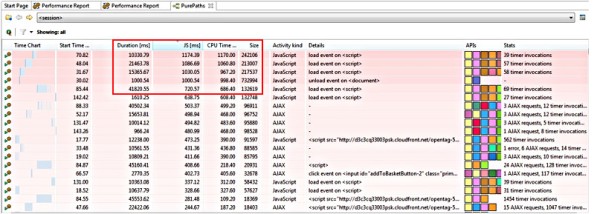
JavaScript comparison – note discrepancies between execution time & total duration, CPU overhead and size (dynaTrace AJAX Edition)


Individual script – time distribution breakdown (Transfer/Wait/Server); Long duration script – individual call stacktrace examination
- Images/multimedia
Images and multimedia content often represent a huge proportion of the total payload of a page. This is a very fertile area for enhancement, and also for the application of effective governance of acceptable content specification. It is important to avoid bad practice such as HTML based scaling.
Content format should be considered, both in terms of relevance to the image type – icon, animation, transparency etc, and the recipient user device. The former is covered well in the relevant chapter of Steve Souders ‘Even Faster Websites’, though note that the SmushIt tool is unfortunately no longer available. Some visibility of the effect of optimal compression (at least as far as .png images are concerned) can be gained from using other open source tools such as pngcrush (http://pmt.sourceforge.net/pngcrush) or png gauntlet (pmggauntlet.com).
Efficient image handling by particular devices is facilitated by using an appropriate format – WebP images for Android mobile devices will save some 30%, for example. Compression is also important, although some of the most dramatic savings are delivered by ensuring that quality is the ‘minimum acceptable’ rather than ‘best possible’. This is a subjective decision, but well worth exploring, especially for small format mobile devices.
Having determined and stored a set of ideal images, delivery can be managed automatically by reference to the visitor browser user string. These services are offered as options from established major vendors such as Akamai and Adobe Scene 7. The imgix site (https://sandbox.imgix.com/create) is worth exploring, both a source of services, but also (using their sandbox) to examine the effect on overall size of changing specific parameters.
With regard to monitoring multimedia streams, it is worth referencing that several major APM vendors are planning this capability as an extension to RUM functionality in their downstream roadmaps.
- Network based investigation
Synthetic test tooling essentially operates by analysing network interactions between delivery infrastructure and user client (with varying degrees of sophistication).
Much of this information is derived from PCAP (packet capture) data. This is usually represented graphically using a waterfall chart. Such charts can provide much useful information in addition to the parsing of individual object delivery (ie partitioning between DNS lookup, connection, first byte and content delivery times).
Such aspects as blocking behaviour, asynchronous/synchronous delivery and the absence of persistent connections are clearly shown. Side by side comparison of waterfalls with different page response time outcomes is a useful technique.
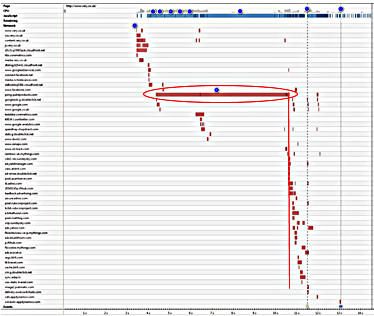
3rd party JavaScript blocking activity (due to interaction with 3,000+ DOM nodes) [Chrome Developer Tools]
In certain cases, it may be useful to examine traces from ‘full fat’ network tracing tools (such as Gomez Transaction Trace Analyzer or WireShark/CloudShark). The image below illustrates the use of Cloudshark to investigate/confirm server response latency by identifying delay between network SYNchronise and ACKnowledge responses.
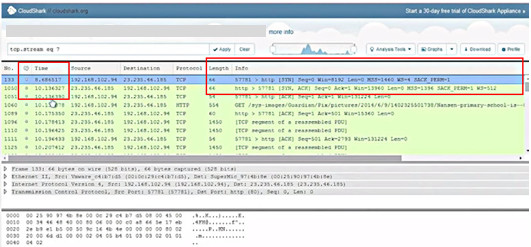
Pinpointing server latency (CloudShark example)
- Other aspects
The above highlight some of the most fertile areas for potential optimisation. Many others exist, for example cache/compression handling, 3rd party content interactions (including ‘daisy chaining’ behaviour by introduced affiliate tags (a potential security as well as performance, issue).
Poor performance by design or governance practice include the presence of multiple/outdated versions of affiliate tags or jQuery libraries, and sites with excessive numbers of DOM nodes. Although a not infrequent cause of performance inefficiency, the latter is good example of a finding that is not amenable to immediate change, as it requires a fundamental rebuild of the site.
The blocking behaviour of stylesheets and fonts is worth considering – in the case of fonts particularly if your user base has a high proportion of Safari users due to this browser’s poor response to missing content.
Two examples that highlight potential cross domain content interrelationship issues:
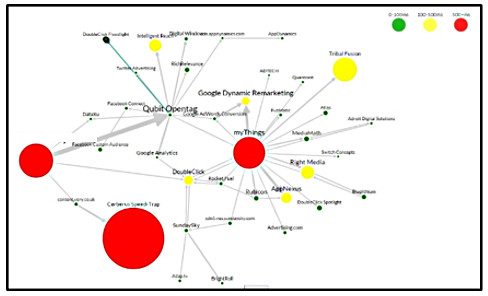
Third party latency map (Ghostery)
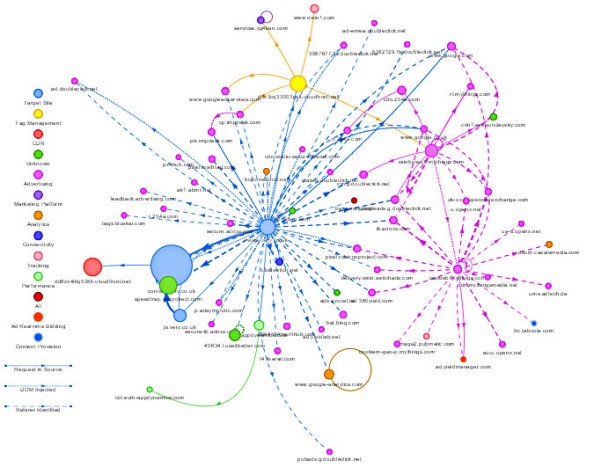
3rd Party interrelationships by type ( RequestMap [NCC Group]) – open source
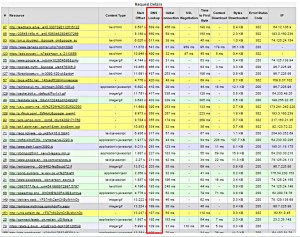
Further detail – third party affiliate tag content by DNS response (WebPage Test)
Tools of this type can be extremely useful in visualising issues, particularly in sites with heavy affiliate content loads.
- CDN Performance Assurance
Content Delivery Network (CDN) usage is extremely pervasive, both for ‘core’ content and by third parties. A useful first step is to screen your target site with a tool such as CDN Planet’s CDN finder tool (http://www.cdnplanet.com/tools/cdnfinder). This will, in most cases, display a list of CDNs detected by domain. CDN technology is very powerful, but needless to say, it does not have miraculous powers. Like any other tool, it is reliant on correct initial configuration, both of the CDN itself and the cache settings of the accelerated site. Individual CDNs do vary in efficiency, particularly between global regions. For all these reasons, it is worth undertaking a CDN performance assurance test, providing that you have suitable tools at your disposal. Today, this means dynaTrace Synthetic (formerly Gomez) ‘Last Mile’ network, or the equivalent feature in Catchpoint.
Both Vendors offer the ability to test from a distributed network of consumer PCs. ISP based testing is of limited use for this purpose (for reasons that I don’t have space to go into). Although in an ideal world ongoing assurance testing (linked to a Service Level Agreement) is beneficial, in practice a limited test of 24 or 48 hour duration will pick up any gross issues.
Two aspects are useful for FEO screening purposes:
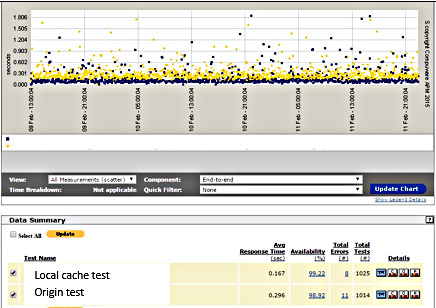
- Providing that it is possible to set up testing directly against the origin content (by- passing the CDN) – this will depend on how the site is coded with regard to the CDN – set up parallel tests from end user locations in relevant geographies. One test navigating to the origin servers, and the other to the local (CDN) cache.
The discrepancy between the response values obtained is effectively what you are paying the CDN for. In the example below, an average acceleration of 77% was delivered during the period of test. For ongoing tests (eg for operations dashboards etc), it is easier to visualise using average line traces rather than scattergrams.
- Using reverse IP lookup, examine the origin location for the CDN content. Bear in mind that CDN delivery is dynamically optimised for performance, not origin location. However, such inspection can pull up examples of poor configuration where present (the example below is normal, although the range of origin locations (delivering content to an exclusively UK user base) is interesting.
CDN performance assurance – target international market – origin vs local cache response
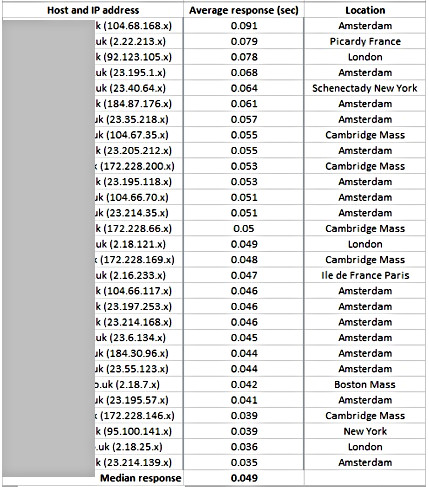
CDN host response by location
In my next post (Introduction to Granular analysis Part 3), I will briefly cover approaches to analysis of delivery to mobile devices.
